Gap Between Rich and Poor Growing in the U.S.
Tax Day Not Too Taxing for Super-rich, Charts Suggest
April 18, 2011The Lookout - So it's Tax Day in America. If you're feeling glum after filing your return, cheer up. There's hope that you may be able to get the better of the IRS in the end: All you have to do is become super-rich.
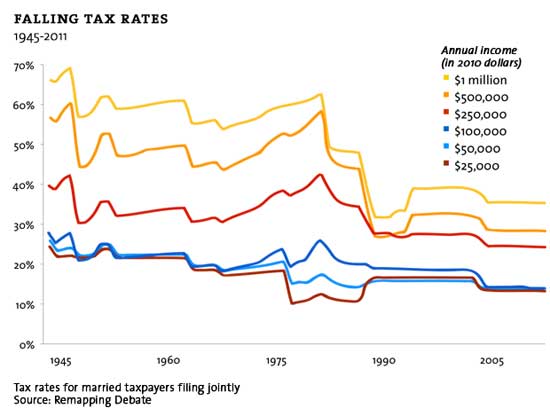
As a group of new charts put together by Mother Jones magazine (some shown below) illustrates, the tax burden for the very wealthiest Americans has been falling steadily in recent years. At the same time, as we've noted before, that group--with annual earnings over $500,000--has seen its income rise astronomically. For most Americans, income growth has been anemic.
Yet not everyone agrees that the larger picture these charts and others like them convey--of an America where the rich are doing better and better while everyone else struggles to get by--accurately depict the country's economic landscape. Some have argued that what looks like increasing income inequality since the 1980s is in fact driven in part by changes in the tax code that have encouraged businesses to report earnings as personal income rather than corporate income, negating the categories as accurate indicators of the country's underlying distribution of wealth. Others have pointed out that because of socioeconomic mobility, the super-rich change from year to year, so the people who got richer ten years ago aren't the same people getting even richer today.
This chart by Mother Jones shows how income tax rates for the tiny percentage of Americans making half a million dollars a year or more have dropped precipitously in the post-war years, as rates for everyone else haven't declined nearly as much.

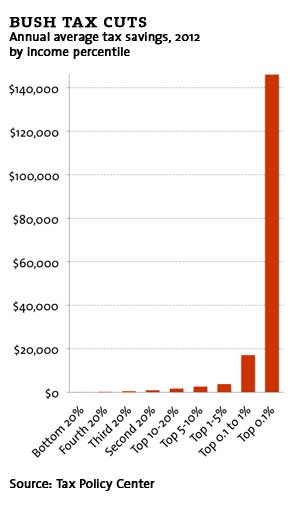
This next one illustrates that, thanks to the Bush tax cuts enacted in 2001, the richest 0.1 percent of Americans will save more than $140,000, on average, on their 2012 taxes. Ninety-nine percent of Americans will save less than $4,000, and for most it will be much less.

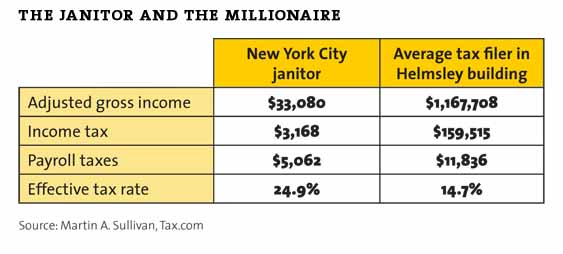
And this last one reveals that the average New York City janitor makes just over $33,000 a year, while the average resident of the Helmsley Building on Park Avenue makes nearly $1.2 million. And yet the former pays an effective tax rate of 24.9 percent, while the latter pays just 14.7 percent. (Why single out the Helmsley Building? Its namesake Leona Helmsley is said to have declared that "only the little people pay taxes" before she was jailed for tax evasion.)

On Tax Day 2011, the weight of the evidence suggests that the disparity between rich and poor has been growing over the last 30 years--and that changes to the tax system have played a role in that. As Washington gets set to consider an overhaul to the tax code and a possible end to the Bush tax cuts for high-earners, that's worth noting.
Do the Poor Really Pay No Taxes?
April 14, 2010
Ezra Klein, The Washington Post - As Jon Stewart details in the clip above, some in the media have fastened on a Tax Policy Center report saying that 47 percent of Americans pay no federal income tax. Is it true? In a very limited sense, yes, about 47 percent of households are owed more in federal help than they pay in federal income tax. But it's not because they don't owe federal income tax. It's because they're owed other money that runs through the tax code.
The Earned Income Tax Credit, for instance, is an income-support program created by Richard Nixon and expanded by both Ronald Reagan and Bill Clinton. The underlying idea came from legendary conservative economist Milton Friedman. So this is bipartisan stuff. And it was designed to run through the tax code rather than just send recipients a separate check. So if your income is low, you may (1) owe very little in income taxes, and (2) get a check through the EITC. The result isn't that you don't owe anything in federal income taxes, but that your income tax liability is wiped out by your EITC check. The critics of the tax code don't seem to know this, but their problem is with programs like the EITC -- of which there are many, some of which help the middle class -- not income tax brackets.
That accounts for a lot of the people who don't owe federal income taxes. But it doesn't account for the bigger dodge here: Why are we talking about federal income taxes at all?
I'm going to be charitable on this and assume that people are biased toward their own experiences rather than playing loose with the data. For upper-income folks -- journalists, television executives, congressmen, think tank employees -- the big hit is on income taxes, so they get pretty annoyed when they hear that lots of Americans don't pay any income tax. But their experience is not typical. Most people's tax burden has a very different composition. As David Leonhardt points out in a typically excellent column today, "about three-quarters of all American households pay more in payroll taxes, which go toward Medicare and Social Security, than in income taxes." And that doesn't even mention state and local income taxes.
So let's mention them. The following graph comes from a report (pdf) by Citizens for Tax Justice. It compares the share of the total tax burden -- that means income taxes, payroll taxes, state and local taxes, capital gains taxes, and so forth -- with the share of the total income for different groups. It's the single most important graph to understand our tax system.
Doesn't look so disproportionate now, huh?
- Look Closer at the 47%, David Leonhardt, The New York Times
- About That 47%, Michael Tomasky, The Guardian
- GOP Hypocrisy on the 47%, Derek Thompson, The Atlantic


No comments:
Post a Comment