Total U.S. Federal Revenue Requested for 2013 is $2.9 Trillion and Total Expenditures Requested is $3.8 Trillion (for a Deficit of $901 Billion); Obama Orders $109 Billion of Reductions to Military and Domestic Programs Starting in October 2013
Obama signs order for $109 billion in 2014 sequester cuts
April 10, 2013
Reuters - Just hours after proposing a budget that would replace automatic spending cuts required by law, President Barack Obama on Wednesday set in motion the next $109 billion of the reductions to military and domestic programs for the year starting on October 1.
The White House announced that Obama signed the sequester order, which directs that total discretionary spending for fiscal year 2014 be cut by $91 billion to a total of $967 billion - the lowest level since 2004.
Obama was required by law to sign the order after submitting his budget request to Congress. The appropriations committees in the House of Representatives and the Senate are holding hearings this week over how to divide the dwindling discretionary funding pie for programs ranging from education to weapons development to national parks.
Little has been done to stop the initial $85 billion in cuts that went into effect on March 1 and threatens to prompt temporary layoffs for hundreds of thousands of government workers and defense contractor employees.
If left in place, the sequester would force about another $1.1 trillion in across-the board spending cuts over a decade.
The Republican budget, authored by Representative Paul Ryan and passed by the U.S. House of Representatives last month, keeps the sequester savings in place, and maintains the same $967 billion spending cap now ordered by Obama for fiscal 2014.
But Obama's budget, like the one passed by Senate Democrats, proposed to replace the sequester, largely through tax increases on the wealthy and spending cuts elsewhere, including health, and a lower inflation gauge for cost of living increases associated with tax brackets, Social Security, and other programs.
The budgets represent a starting point for talks in the next few months over deficit reduction as a new debt limit increase deadline looms by August.
Current US Discretionary Federal Budget and Spending
About.comApril 10, 2013
What Is Discretionary Spending?:
Discretionary spending is that part of the U.S. Federal Budget that is negotiated between the President and Congress each year as part of the budget process. It includes everything that is not in the mandatory budget, which are programs required by law to provide certain benefits, such as Social Security and Medicare.
What Was Requested in the FY 2014 Discretionary Budget?
Discretionary spending in the FY 2014 budget was cut to $1.242 trillion. The request for military spending
was lowered to $618 billion. This includes the Defense Department,
Overseas Contingency Operations and other defense-related departments
like Homeland Security and the State Department. The non-security budget request was increased to $624 billion.
Here's the breakout for the major departments:
Here's the breakout for the major departments:
- Education, increased to $71.2 billion.
- Health and Human Services, increased to $78.3 billion. However, this includes Social Security Trust Funds to support administration of Medicare.
- Housing and Urban Development, reduced to $33.1 billion.
- The Justice Department, decreased to $16.3 billion.
What Was Approved in the FY 2013 Budget
The
FY 2013 budget was never actually approved. Instead, Congress enacted
several continuing resolutions to keep the government running.
Therefore, these are the estimated expenditures based on the
appropriations bills. Discretionary spending in the FY 2013 budget will total $1.258 trillion.
This consists of $651 billion for military spending. This includes the Defense Department, Overseas Contingency Operations and other defense-related departments like Homeland Security and the State Department.
The non-security budget request was $606 billion. All departments were cut or stayed about the same, except for the Department of Education, which increased to $69.8 billion. The largest departments were cut the most:
What Was Spent in the FY 2012 Discretionary Budget?This consists of $651 billion for military spending. This includes the Defense Department, Overseas Contingency Operations and other defense-related departments like Homeland Security and the State Department.
The non-security budget request was $606 billion. All departments were cut or stayed about the same, except for the Department of Education, which increased to $69.8 billion. The largest departments were cut the most:
- Health and Human Services, reduced more than 10% to $71.7 billion.
- Housing and Urban Development, also reduced 10% to $35.3 billion.
- The Justice Department, which was slashed 33% to $17.9 billion.
In FY 2012, discretionary spending was $1.285, less than the $1.344 trillion requested in the FY 2012 budget.
Security spending came in at $671 billion, while non-security spending
was reduced to $614 billion.
How Did the Discretionary Budget Affect the U.S. Economy?
Although stimulus spending has been blamed for increasing the budget deficit, in fact military spending has been the largest contributor to deficit spending. This deficit spending, which has been ongoing since 2002 thanks to the War on Terror, created more than a $15 trillion debt.
Now that the debt to GDP ratio is more than 100%, it may threaten economic growth over the long term. It puts downward pressure on the dollar's value, increasing the price of imports. It decreases the expectation that this debt will be paid, acting as a tax and hampering on economic growth. However, this hasn't happened yet because Europe and other developed markets are doing worse, making the U.S. economy and dollar look like a safer investment by comparison.
Federal Budget 101 Where Does the Money Go?
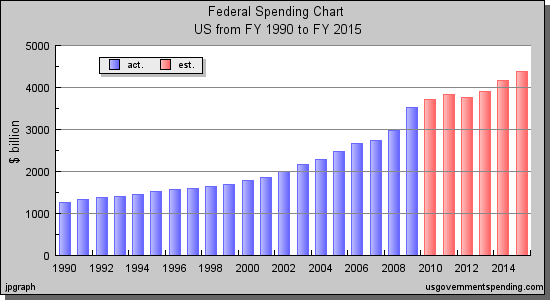
In fiscal year 2011, the federal government spent $3.73 trillion. These trillions of dollars make up a considerable chunk—around 24 percent—of U.S. Gross Domestic Product (GDP). That means that federal government spending makes up a sizable share of all money spent in the United States each year. So, where does all that money go?Mandatory Spending, Discretionary Spending, and Interest on Debt
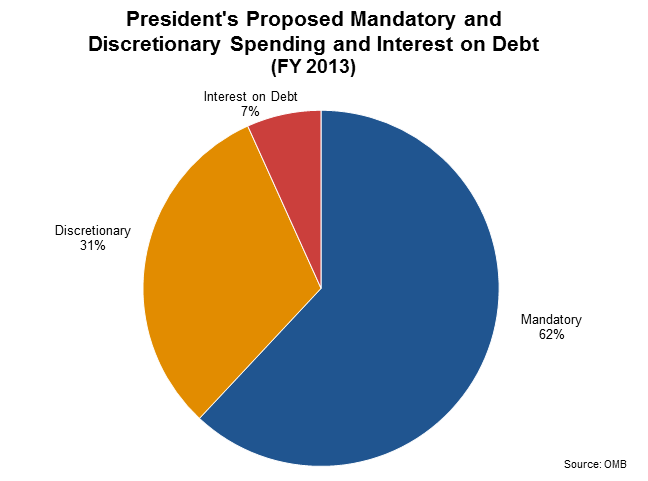
The U.S. Treasury divides all spending into three groups: mandatory spending and discretionary spending and interest on debt. Interest on debt, which is much smaller than the other two categories, is the interest the government pays on its accumulated debt, minus interest income received by the government for assets it owns. This pie chart shows all projected federal spending in 2013 broken into these three categories.
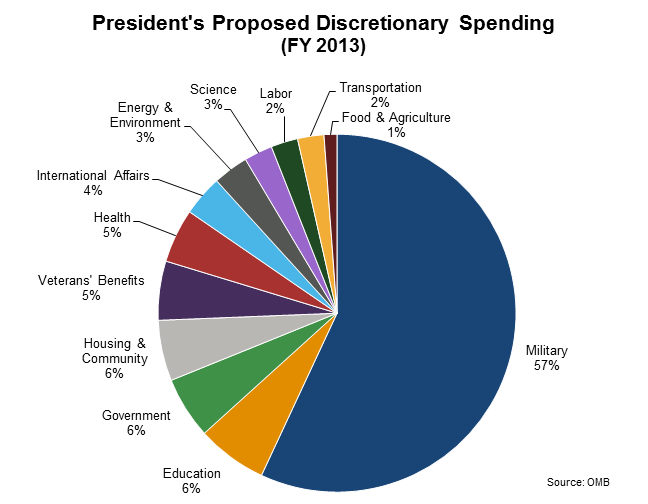
Discretionary spending refers to the portion of the budget which goes through the annual appropriations process each year. In other words, Congress directly sets the level of spending on programs which are discretionary. Congress can choose to increase or decrease spending on any of those programs in a given year.
The discretionary budget is usually around one-third of total federal spending.
This pie chart shows how President Obama proposed dividing up discretionary spending in fiscal year 2013.
Mandatory spending is largely made up of earned-benefit or entitlement programs, and the spending for those programs is determined by eligibility rules rather than the appropriations process. For example, Congress decides to create a program like the Supplemental Nutrition Assistance Program (SNAP), also known as food stamps. It then sets criteria for determining who is eligible to receive benefits from the program.
The amount of money spent on mandatory programs each year is then determined by how many people are eligible and apply for benefits. Congress therefore cannot decide each year to increase or decrease the budget for mandatory programs. Instead, it can review the eligibility rules and may change them in order to exclude or include more people.
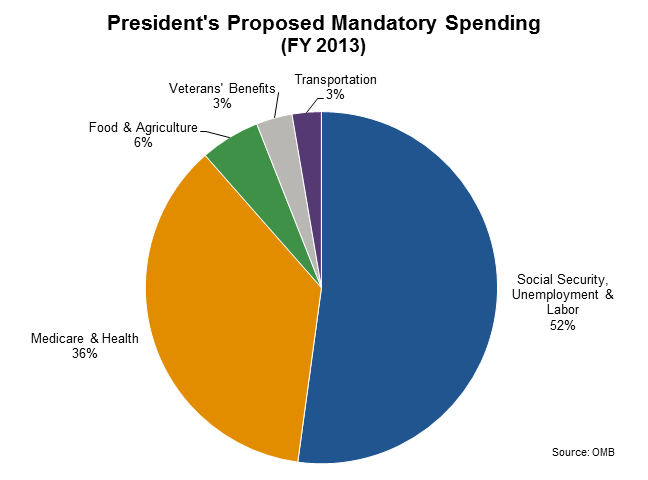
Mandatory spending makes up about two-thirds of the total federal budget. By far the largest mandatory program is Social Security, which comprises around one-third of mandatory spending and around 20 percent of the total federal budget.
This chart shows where the projected $2.1 trillion in mandatory spending will go in fiscal year 2013.
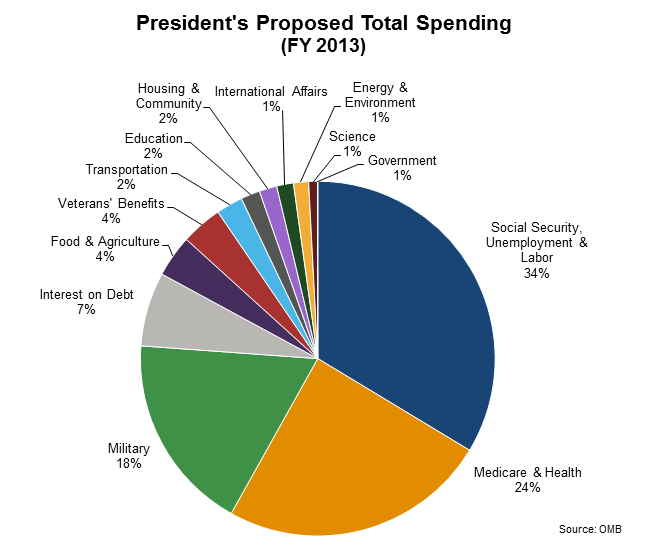
Finally, putting together discretionary spending, mandatory spending, and interest on the debt, you can see how the total federal budget is divided into different categories of spending.
This pie chart shows how President Obama proposed dividing up the whole federal budget in fiscal 2013. Income security programs like Social Security and unemployment insurance together comprise the largest slice, followed by Medicare & Health and Military.
Related:
A Brief Guide to the Federal Budget and Appropriations Process


