Public School Systems Spent Recklessly on Wages, Benefits and Pensions During the Real Estate Bubble Years, and Continue to Do So; Property Values are Dropping But Property Taxes Are Not
Could Declining House Values Spark the Next Taxpayer Rebellion?
Local governments levy real property taxes, which are the greatest form of income for a state government; the majority of real property tax revenue is distributed towards public schooling. Property taxation and school funding are closely linked in the United States, with nearly half of all property tax revenue used for public elementary and secondary education. You might think property taxes have declined 30%, paralleling declines in housing values. But nope — property tax revenues have shot up 27% just since 2006.March 30, 2011
Of Two Minds - Something remarkable happened to property taxes in the U.S. while housing lost 31% of its value from 2006 to 2009: they went up by $100 billion (27%). Equally remarkably, as we can see from this U.S. Census Bureau data on state and local tax revenues, property taxes went up even when housing slumped in the early 1990s.
So though U.S. housing continues losing value–U.S. home prices declined in January, continuing a downward trend that began in August, with average U.S. home prices retreating to summer 2003 levels, according to the S&P Case-Shiller home-price indexes–property tax revenues continue their inexorable rise.
I’ve plotted out the total national property tax revenues on a chart of the Case-Shiller home-price index.
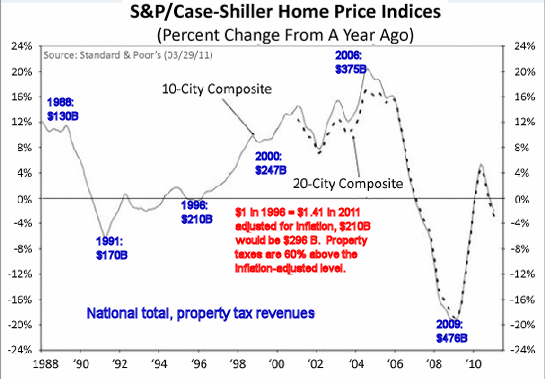
According to the Bureau of Labor Statistics inflation measures, if property taxes had risen along with inflation, the total property tax revenues nationally would have risen from $210 billion in 1996—more or less about the start of housing’s decade-long bubble—to $296 billion in 2011. But property taxes totaled $476 billion in 2009, a solid 60% ($180 billion) above inflation.
So even as the net worth of property has fallen by a third, the property taxes collected from the owners have risen 27%. Exhibit A in this ceaseless rise of property tax revenues is the structural shortfalls in state and local government budgets between what was promised to various fiefdoms and constituencies at the apex of various bubbles, and what is sustainable in non-bubble times.
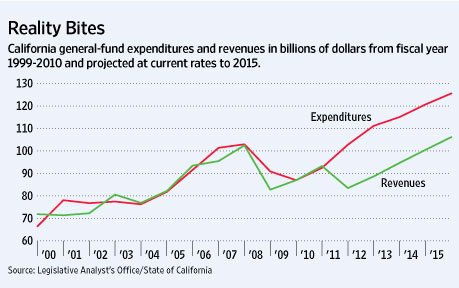
Here is a chart of California’s systemic gap between revenues and expenditures. Please note that the apparent alignment of revenues and expenditures in 2010-11 is entirely illusory: the budget gap is $26 billion or perhaps more, once the fantasy accounting is removed.
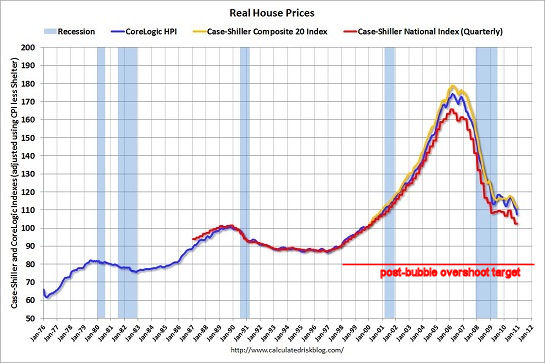
And here is a chart of house prices in a classic symmetrical post-bubble deflation. I’ve drawn a target which is drawn from the reversion-to-the-mean model that the majority of bubbles track: prices don’t just retrace to the starting lift-off point, they overshoot to a level below that initial line.
As I reported in House Values Fall 30%, But Property Taxes Keep Rising (December 22, 2010), the nation’s state and local governments will collect an estimated $476 billion in property taxes in 2010–about 90% of state income tax revenues of $250 billion and sales tax revenues of $286 billion combined.
A decade ago, property taxes were roughly equivalent to sales taxes. In 2000, property taxes totaled $247 billion and sales taxes came in at $223 billion—a differential of roughly 10%. Sales taxes have increased by 28% since 2000—roughly in line with the rise in consumer prices.
State income taxes have risen nationally from $217 billion in 2000 to $250 billion in 2010, after peaking at $303 billion in 2008, just as the global financial meltdown began. That’s a rise of $33 billion, or 15%—actually less than inflation (27% from 2000 to 2010).
Add all this up and we can see that local governments have become far more dependent on property tax revenues than they were in 2000. Thanks to stiff increases in junk fees and taxes of all kinds, state and local government revenue has climbed back to its pre-recession height of $1.29 trillion, roughly equal to the $1.32 trillion collected in 2008. In terms of total tax revenue, the recession is over—yet the gap between expenditures and revenues continues to widen in most states and local governments.
As their properties continue sliding in value, devastating their net worth, do you reckon the average homeowner might start resenting the rapid rise of the taxes they pay for the privilege of owning real estate?
Imagine if your income taxes rose by 27% even as your income declined by 30%.
The ultimate tax hostage is the property owner. The business owner can pull up stakes and leave, the wage earner can transfer or get another job elsewhere, and the consumer can restrict his/her consumption to lower the burden of sales taxes, but the property owner is the perfect tax donkey because the transaction costs of selling are so prohibitive.
With some 11 million homeowners owing more on their mortgage than their house is worth, i.e. they are underwater, then selling is no longer an option unless the bank accepts a short-sale—something the lenders are loathe to do.
Given that there’s about 48 million mortgaged homes now, then those 11 million represent about 23% of all homeowners.
How long will property owners keep swallowing significantly higher property taxes even as the value of their real estate continues declining? It’s an open question. I suspect the answer won’t be known until some invisible breaking point is reached, and voters simply rebel against higher taxes while their own net worth and incomes stagnate.
Just because there is little visible resistance to sharply higher property taxes (and other taxes and junk fees as well, of course) doesn’t mean resistance isn’t building below the surface, unreported by a financial media obsessed with the S&P 500 as the only metric of wealth and prosperity and unnoticed by state and local governments obsessed with stripmining more tax revenues by any means at hand.
The tax donkey is already weighed down with a heavy load, and it won’t take much more than a double-dip recession, higher prices for essentials and declining home values to snap the pack animal’s weakened back.
The rising S&P 500 looks good as propaganda, but for most Americans, that’s about as edible and nourishing as an iPad.
Extravagant Spending Leads to FY11 Budget Woes
Loudoun County Public School is by far the largest employer in Loudoun County, Virginia, employing more than 10,000 people in 2009. With a budget of $738,988,960 for fiscal year 2010, and with 80% of the typical school budget going to salaries, health benefits and pensions, that amounts to $591,191,168 spent on employees and retirees.February 16, 2010
Loudoun Taxpayers for Responsible Government - The Loudoun County FY 2011 budget process promises to be one of the most challenging ever. Too much spending and too much borrowing during the housing bubble years of the past decade has elevated spending to exorbitant levels. County bureaucrats want to keep it that way with a proposed 10% tax hike on Loudoun homeowners.
In a recent video promoting his bloated $764 million budget proposal -- $32 million more than the adopted FY10 budget -- LCPS Superintendent Ed Hatrick stated that in a “normal” year he would have asked for a staggering $815 million.
He has become accustomed to such exorbitant increases and surely would have asked for that much, or more, had the BOS not provided fiscal "guidance" limiting his budget to a 5% increase in local tax funding.
To put $815 million in perspective, it is enough to fund enrollment growth plus 6% at a time when inflation is just over 2% a year. It would require a 17% tax hike.
Today’s bloated budget is a direct result of too many of those “normal” years in the past 10 years. The following table details the adopted school budget history, as well as projected budget “needs” from the FY10 adopted school budget document, which would reach $1 billion dollars by FY13!

Factoring out growth, Loudoun is spending 69% more per pupil in FY10 than in FY00. It is hard to draw a conclusion that the current school budget is anywhere close to being underfunded, even after the FY10 correction in which LCPS received its first decrease in funding in 18 years.
If funding had just kept pace with enrollment growth and inflation since FY00 (2.8% a year on average), the FY11 school budget would need to be only $631 million, instead of the $764 million Hatrick is asking for.
The general county operating budget has also been overfunded.

While the budget has grown because of population growth, there has been an astounding growth in per capita spending over the past 10 years. More people, plus twice as much spending per person is a recipe for a fat budget!

The funding increases from FY00 to FY08 were anything but normal. In fact, it could well have been the biggest run-up in spending ever. Increasing the rate of spending on a per capita or per pupil basis at 3 times the rate of inflation is excessive and unsustainable without massive property tax increases.
Housing Bubble Revenue Fuels Unprecedented Budget Growth
All homeowners are aware of the numerous double-digit property tax hikes during the housing bubble era, but it is lesser known that the county became dependent on other taxes and fees related to real estate transactions and development. They proved to be just as cyclical as the real estate market itself and when the housing bubble burst, revenues plummeted as depicted in the following graph.

Then there are revenue sources that rose drastically in the first half of the decade and have since tapered off. Many of these were related to wealth generated by the housing bubble, such as sales, personal property and income taxes. The state coffers were also overflowing, fueled by rising incomes and a state-level tax increase enacted during Governor Warner’s administration, which resulted in a big jump in state aid to localities.

The BOS was able to use rising property values as an excuse to raise the average tax bill by as much as 18% a year. There was little outrage from homeowners blinded by their new-found wealth. It was analogous to when Walt Disney Company stock was flying high and Michael Eisner received nearly a billion dollars in stock options, but shareholders did not care as long as the stock price continued to rise and they were making money.
After the housing bubble burst and other revenue sources either declined or were flat, the BOS turned to their good ol’ reliable ATM – Loudoun homeowners – to make up the difference and continue spending at the level they had become accustomed to. The fact that housing values peaked in 2006 and have declined every year since was not a hindrance. It was time to work the other part of the tax bill equation – the tax rate, which increased a low of 89 cents in 2006 to a proposed $1.40 in 2010.
While the soaring tax rate was bad enough for homeowners, it was particularly hard on business owners because commercial property values were still rising. Is it a wonder so many businesses have folded over the past few years? How is sharply increasing the cost of business going to help attract new businesses to Loudoun to help relieve the disproportionate homeowner tax burden?
What happens during economic upturns is that the county will drastically increase spending and consider it normal. Of course, county officials don’t like to remind folks of the good ol' days when spending was skyrocketing. In the aforementioned video (actually, it’s more of an infomercial format) Hatrick has a chart of per-pupil spending that only goes back to FY06, which leaves out the biggest run-up in spending.
Other Graphs (from Fairfax County Taxpayers Alliance):

FCTA Testimony on the Fairfax County Public Schools Proposed FY2012 Budget
By Arthur G. Purves - President, Fairfax County Taxpayers Alliance
January 24, 2011
Dr. Dale and Members of the Board:
Good evening. My name is Arthur Purves. I address you as president of the Fairfax County Taxpayers Alliance.
Recently a Taxpayer Alliance board member emailed the school board to express concerns about rising taxes. The reply, from an at-large school board member, stated that one reason for increased taxes is that FCPS has to pay next year $8.1 million to implement an unfunded mandate for online testing.
One would conclude from the school board email that unfunded mandates were the primary driver of higher school spending. That would be an incorrect conclusion. In his FY2012 budget proposal, the superintendent has proposed $99 million of spending increases.
Of that, $47 million is to give all school employees average raises of 4 percent, since they have gone without raises for two years. However, between 2001 and 2009, county and school raises exceeded DC area private sector raises by 300 percent (22% vs. 7.3%0) I doubt that many private-sector businesses will be giving 4 percent raises to all employees next year.
Another $33 million is for increased pension and health insurance costs, even though private-sector taxpayers are far less likely than county workers to have pensions and health insurance. When you include pensions and health insurance, school and county workers are far better compensated than the private sector. Are you and the neighboring school districts being fair to taxpayers when you raise taxes so that county employees can have better raises and benefits than the taxpayers who fund them?
Does student achievement justify higher taxes? We think not. According to the ACT college admissions test results for Fairfax County Public Schools, last year only 44 percent of the students tested were prepared for college. Also, while FCPS made adequate yearly progress under the No Child Left Behind Act, remember that passing SOL tests requires only “D” level achievement.
While we oppose compensation increases, we heartily agree teachers are overworked. Lighten their load. Special Ed teachers have told us that they need to work 80 hours a week, but only 40 hours is spent teaching; the rest is for IEPs, which are federally mandated. Here’s a solution: as a school board you can declare all your schools to be charter schools, waive the unnecessary and burdensome mandates and let your teachers teach.
In summary, we believe that the school board is unfair to taxpayers, overstates academic achievement, and unnecessarily burdens its teachers.
Thank you.
Testimony to the Fairfax County Delegation to the Virginia General Assembly
By Arthur G. Purves - President, Fairfax County Taxpayers Alliance
January 8, 2011
Distinguished Members of the General Assembly:
My name is Arthur Purves. I address you as president of the Fairfax County Taxpayers Alliance.
Virginia’s current budget crisis was preceded by a ten-year spending binge. According to the Virginia General Assembly’s Joint Legislative Audit and Review Commission’s Review of State Spending: 2007 Update, between 1998 and 2007, the Virginia budget doubled, from $17.6 billion to $35 billion.
The report (Table 4) states that during this period Virginia public college inflation-adjusted budgets increased three times faster than enrollment (46% vs. 15%), inflation-adjusted spending for public schools increased four times faster than enrollment (37% vs. 9%), and Medicaid spending adjusted for Medical Inflation increased four times faster than population (48% vs. 12%). Unbelievably, public school staff increased five times faster than enrollment (48% vs. 9%).
However, according to the 2010 ACT college admissions test results for Virginia, only 31 percent of the 19,236 Virginia students taking the test were prepared for college. While the Standards of Learning (SOL) testing program has accredited most schools, passing the SOL tests (“Pass Proficient”) represents “D” level work. When I queried the VDOE database to find the percent of students who scored at “Pass Advanced”, which is a much better indicator of college preparedness, the response I got was “The data you have requested would require 303 columns. The most allowed by Excel is 256. Please adjust your request to decrease the number of columns” with no guidance on how to reduce the number of columns.
College achievement is also decreasing while college tuition increases. Why does college tuition outpace inflation? I cannot find a JLARC report on the topic.
Medicaid funds healthcare for those in poverty. Isn’t the solution to educate low-income children so they can become self-supporting adults? However, despite decades of lip-service to the minority student achievement gap it is clear that our public schools, with their progressive anti-phonics, anti-drill, anti-fact, atheistic curriculum cannot close it. Why do you give state and local school boards veto authority over charter schools when these boards are unable to educate their own students?
After decades of massive public-education funding with paltry results, you should cut education spending and open the way to school competition.
Massive spending on education and healthcare is one of the major reasons there is inadequate funding for roads and bridges. The other reason is Dulles Rail. Five billion dollars for Dulles Rail is five billion diverted from road and bridge construction. The Dulles Rail project construction began without a viable financial plan. The Airports Authority will not disclose how much it will raise tolls to pay for it. The expectation is that tolls will increase ten-fold. Support Delegate LeMunyon’s bill to require Loudoun and Fairfax supervisors to vote on all toll road increases. If Dulles Rail collapses because of this, let it be a monument to reckless local and state government budgeting.
Dulles Rail is not too big to fail.
Thank you.


No comments:
Post a Comment