Nuclear Deal with Iran Allowed Its Return to the Global Oil Market; the Additional 1-2 Million Barrels Per Day from Iran will Result in a Sustained Drop in the Price of Oil
Oil dives below $35, lowest in 11 years, as U.S. supply swells
January 6, 2016Reuters - Crude oil prices plunged 6 percent on Wednesday, diving below $35 per barrel for the first time since 2004 as data showing a shockingly large build-up of U.S. gasoline supplies fed fears that a global surplus was still growing.
The sell-off, the biggest one-day drop for global benchmark Brent futures since the start of September, takes losses this year to more than 8 percent, a descent stoked by worsening Chinese economic data, the world's No. 2 oil consumer, and a fierce row between Saudi Arabia and Iran that some say may be more bearish than bullish.
The focus on Wednesday was U.S. government data showing a 10.6 million-barrel surge in gasoline supplies, the biggest build since 1993, which some traders said signaled a slow-down in demand that could prolong the global glut. The figures overshadowed a 5.1 million-barrel fall in crude stocks. [EIA/S]
"Gasoline was the sole source of strength within the complex, and that looks to have ended," said John Kilduff, a partner at energy hedge fund Again Capital [an oil speculator, see below: Behind Oil Price Rise: Peak Oil or Wall Street Speculation?].Brent futures LCOc1 fell $2.19 to settle at $34.23 a barrel. Earlier, it fell to as low as $34.13, its lowest level since the start of July 2004.
U.S. crude futures CLc1 fell $2.00 to settle at $33.97 a barrel, its lowest close since February 2009.
Traders shrugged off rising geopolitical risks, including an apparent North Korea nuclear test. Many reckoned that the row between Saudi Arabia and Iran posed little threat to oil shipments, but made an agreement on output even less likely.
"I think we'll see a price war soon to keep market share," said Tariq Zahir, an analyst at Tyche Capital Advisors. "Prices will get lower and I think we'll hit $32 again."
Iran Nuclear Deal Likely To Cause Sustained Drop In Oil Prices
July 16, 2015Americans.org - Terrible days lie ahead for oil exporters after the Iran nuclear deal opened the world to additional oil supplies from the oil rich country. Already blessed with some of the deepest oil reserves in the world, Iran’s comeback in the oil market will further tilt oil prices downward, spelling liquidity problems for exporters and greater travel options for end consumers.
Oil prices dipped on Wednesday after the news of the Iran nuclear deal hit the wires. The deal would see decades old sanctions imposed by the U.S., the E.U. and the UN, against the Middle East country eased in exchange for curbing their nuclear program. The sanctions effectively locked out a key player from international oil markets, crippling the country’s export capability and gradually reducing its contribution from over 4 million barrels per day (bpd) at its peak to only 1 million bpd.
With the sanctions lifted, oil prices face an inevitable widening glut that will most certainly mean a negative price hit and in turn a positive boost to the global economy.
Officials from the National Iranian Oil Company reported that Iran’s oil would see an increased production up to 600,000 bpd, confirming an oncoming supply ramp-up. Adding to the report, officials expressed optimism that the country could hit its initial pre-sanctions 4 million bpd if demand were present.
For oil marketers, such news could not have come at a worse time. Already, without a vibrant Iranian supply, the international markets are oversupplied by 2 million bpd thanks to an increased production by Russia, Iraq and the Organization of the Petroleum Exporting Countries (OPEC). Economic problems in China, one of the largest energy consumers in the world, have only served to bring down demand, lending dominance to the economics of the free market and sending oil prices to record lows.
A deal with Iran would mark the entrance of a powerful player starved of a piece of the international market and more than eager to compensate for their years of absence. The markets would definitely immediately respond to the news, and they did.
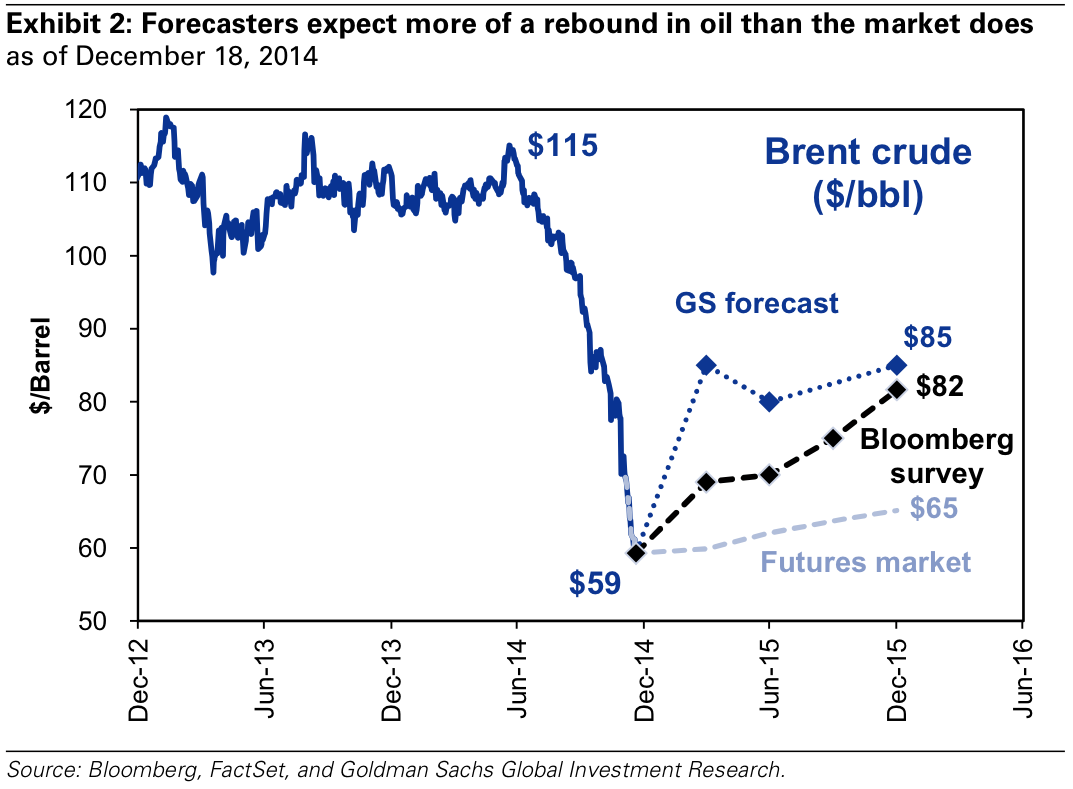
Analysts agree that Iran’s oil could reach the market by early 2016. Analysts at Goldman Sachs estimated Iran’s supply at an additional 200,000-400,000 bpd at the start of 2016, together with the release of an additional 20-40 million barrels in floating storage. In a note to clients, the firm stated, "We view the 2016 prospects for higher OPEC production, including from Iran, as a growing downside risk to our oil price forecast."
As analysts predict a ballooning oil production glut, marketers brace for tougher times ahead. A fierce battle for the oil importing consumers will see prices plummet, benefiting countries which have long been exploited by unreasonably high oil pricing.
Editor's Note: A year ago, in December 2014, Goldman Sachs — a major oil trader benefiting from the Commodities Futures Modernization Act (see below, Behind Oil Price Rise: Peak Oil or Wall Street Speculation?) that was signed into law by Bill Clinton in December 2000 (just before his second term as President expired) — expected a rebound in the oil market:
Behind Oil Price Rise: Peak Oil or Wall Street Speculation? [Excerpt]
March 16, 2012F. William Engdahl - Oil prices rose because of the speculative pressure on oil futures markets from hedge funds and major banks such as Citigroup, JP Morgan Chase and most notably, Goldman Sachs, the bank always present when there are big bucks to be won for little effort betting on a sure thing. They’re getting a generous assist from the US Government agency entrusted with regulating financial derivatives, the Commodity Futures Trading Corporation (CFTC).
A brief look at how today’s “paper oil” markets function is useful.
Since Goldman Sachs bought J. Aron & Co., a savvy commodities trader in the 1980’s, trading in crude oil has gone from a domain of buyers and sellers of spot or physical oil to a market where unregulated speculation in oil futures — bets on a price of a given crude on a specific future date (usually in 30 or 60 or 90 days) and not actual supply-demand of physical oil — determines daily oil prices.
In recent years, a Wall Street-friendly (and Wall Street financed) US Congress passed several laws to help the banks that were interested in trading oil futures, among them one that allowed the bankrupt Enron to get away with a financial ponzi scheme worth billions in 2001 before it went bankrupt. The Commodity Futures Modernization Act of 2000 (CFMA) was drafted by President Obama’s Treasury Secretary, Tim Geithner. The CFMA in effect gave over-the-counter (between financial institutions) derivatives trading in energy futures free reign, absent any US Government supervision, as a result of the financially influential lobbying pressure of the Wall Street banks. Oil and other energy products were exempt under what came to be called the “Enron Loophole.”
In 2008, during a popular outrage against Wall Street banks for causing the financial crisis, Congress finally passed a law over the veto of President George Bush to “close the Enron Loophole.” And as of January 2011, under the Dodd-Frank Wall Street Reform act, the CFTC was given authority to impose position caps on oil traders beginning in January 2011. Curiously, these limits have not yet been implemented by the CFTC. While he has made noises of trying to close the loopholes, CFTC Chairman Gary Gensler has yet to do so. Notably, Gensler is a former executive of, you guessed, Goldman Sachs. The enforcement by the CFTC remains non-existent.
Current estimates are that speculators — futures traders such as banks and hedge funds who have no intent of taking physical delivery but only of turning a paper profit — today control some 80 percent of the energy futures market, up from 30 percent a decade ago.
CFTC Chair Gary Gensler, perhaps to maintain a patina of credibility while his agency ignored the legal mandate of Congress, declared last year in reference to oil markets that "huge inflows of speculative money create a self-fulfilling prophecy that drives up commodity prices."
In early March, Kuwaiti Oil Minister Minister Hani Hussein said in an interview broadcast on state television, "Under the supply and demand theory, oil prices today are not justified."
Michael Greenberger, professor at the University of Maryland School of Law and a former CFTC regulator who has tried to draw public attention to the consequences of the US Government’s decisions to allow unbridled speculation and manipulation of energy prices by big banks and funds, recently noted, "There are 50 studies showing that speculation adds an incredible premium to the price of oil, but somehow that hasn't seeped into the conventional wisdom," Greenberger said. "Once you have the market dominated by speculators, what you really have is a gambling casino."
The result of a permissive US Government regulation of oil markets has created the ideal conditions whereby a handful of strategic banks and financial institutions — interestingly, the same ones dominating world trade in oil derivatives and the same ones who own the shares of the major oil trading exchange in London, ICE Futures [and the same ones that caused the global financial crisis by trading derivatives such as mortgage-backed securities] — are able to manipulate huge short-term swings in the price we pay for oil or gasoline or countless other petroleum-based products.
Let me go on record stating categorically my firm conviction that Israel will not engage in a direct war against Iran, nor will Washington. But the effect of the war rhetoric is to create the ideal backdrop for a massive speculative spike in oil [see article below: "Middle East Supply Interruptions"].
Curiously, one of the real drivers of the oil price bubble is the Obama Administration’s economic sanctions recently imposed on oil transactions of the Central Bank of Iran [this paper was written on March 16, 2012]. By pressuring Japan, South Korea and the EU not to import Iranian oil or face punitive actions, Washington reportedly forced a huge drop in oil supply from Iran to the world market, giving a turbo boost to the Wall Street derivatives play on oil.
In an OpEd in the London Financial Times, Ian Bremmer and David Gordon of the Eurasia Group wrote, “... removing too much Iranian oil from the world's energy supply could cause an oil price spike that would halt the recovery even as it does some financial damage to Iran. For perhaps the first time, sanctions have the potential to be ‘too successful,' hurting the sanctioners as much as the sanctioned.”
Iran was shipping 300,000 to 400,000 a barrels a day less than its usual 2.5 million barrels a day, according to Bloomberg [in 2012 — this paper was written prior to the nuclear deal with Iran, which was finalized on July 14, 2015]. In March 2012, the US Energy Information Administration said in a report that much of that Iranian oil isn't being exported because insurers won't issue policies for the shipments.
The issue of unbridled and unregulated oil derivatives speculation by a handful of big banks is not a new issue. A June 2006 US Senate Permanent Subcommittee on Investigations report on “The Role of Market Speculation in rising oil and gas prices,” noted, “...there is substantial evidence supporting the conclusion that the large amount of speculation in the current market has significantly increased prices.”
The report pointed out that the Commodity Futures Trading Trading Commission had been mandated by Congress to ensure that prices on the futures market reflect the laws of supply and demand rather than manipulative practices or excessive speculation. The US Commodity Exchange Act (CEA) states, “Excessive speculation in any commodity under contracts of sale of such commodity for future delivery . . . causing sudden or unreasonable fluctuations or unwarranted changes in the price of such commodity, is an undue and unnecessary burden on interstate commerce in such commodity.” Further, the CEA directs the CFTC to establish such trading limits “as the Commission finds are necessary to diminish, eliminate, or prevent such burden.”
Where is the CFTC now that we need such limits? The CFTC appears to ignore the law to the benefit of Goldman Sachs and Wall Street friends who dominate the trade in oil futures.
The moment that it becomes clear that the Obama Administration has acted to prevent any war with Iran by opening various diplomatic back-channels — and that Netanyahu is merely trying to use the war threats to enhance his tactical position to horse trade with an Obama Administration he despises — the price of oil is poised to drop like a stone within days.
Until then, the key oil derivatives insiders are laughing all the way to the bank. The effect of the soaring oil prices on fragile world economic growth, especially in countries like China, is very negative as well.
|
|||||||||||||||||||||||||||||
|
|
|
|
||||||||||||||||||||||||||
|
|
|
|
||||||||||||||||||||||||||
| |||||||||||||||||||||||||||||
* By November 24, 2014, after 12 years of rising tensions, negotiators sought to reach a deal aimed at easing fears that Iran will develop nuclear weapons under the guise of developing civilian energy — an ambition Tehran denied. For six days leading up to the November 24, 2014 deadline, Iran and six powers — the US, China, Russia, Britain, France plus Germany — had been negotiating in Austria's capital to turn an interim accord reached with the Islamic Republic a year prior into a lasting agreement. Iran was to scale back its nuclear program in exchange for a lifting of sanctions. Negotiators agreed to nail down by March 1, 2015 what needed to be done by Iran and the six nations it was negotiating with, and by when; a final agreement was meant to follow four months later. On February 20, 2015, after a month-long series of negotiations, talks between the United States and Iran on the Tehran's nuclear program resumed in Geneva. Five months later, on July 14, 2015, an agreement with Iran was reached on the final terms and conditions. The full agreement, called the Joint Comprehensive Plan of Action (available in full here), is 159 pages long.
On November 24, 2013, Market Watch predicted that the price of oil would likely drop after a nuclear deal was struck with Iran:
A nuclear accord between Iran and six world powers potentially paves the way for more crude oil to reach the global market. Iran's oil reserves are among the world's largest, though its exports have dropped off as the U.S. and Europe tightened sanctions.
"There's about a million barrels of oil a day that could be very quickly returned to the global market," said Jason Schenker, economist and president at Prestige Economics, LLC.
Iran exported 1.5 million barrels a day in 2012, down from 2.5 million barrels a day in 2011, according to the Energy Information Administration.
As part of the historic accord, the EU suspended shipping and oil insurance sanctions on Iran. This puts in place the financial infrastructure necessary to sell more oil to the market, even though the embargo on purchasing Iranian oil remains in place for EU members, Mr. Schenker said.
In the past, certain developing economies in Asia, who were allowed to buy Iranian oil, would have had to self-insure the cargo, taking on additional risk. Lifting the restrictions on insurance could allow those legal sales of crude oil to increase, Mr. Schenker said.
"This would allow non-EU countries to potentially buy greater volumes of Iranian crude," he said.
Investors and analysts say the possibility that Iran's remaining exports are cut off, or that a conflict with Iran disrupts Middle Eastern oil production, keeps the price of crude anywhere from $5 to $10 a barrel higher than it would be otherwise.
To be sure, Iran's membership in the Organization of the Petroleum Exporting Countries could mitigate any impact on the global energy market because any increase in Iran's output could be met with supply cuts from Saudi Arabia or other members of the group.
"If they bring any production back to the market the rest of the countries will have to adjust their production lower to keep everything in balance," said Mr. Larry.
How a Nuclear Deal With Iran Could Affect Gas Prices
March 20, 2015
Boston.com - Iran has been developing nuclear
technology for years, with Iranian officials saying the program is for
national prestige, scientific research, and power plants. For just as
long, the U.S. and its allies have been skeptical, worrying that Iran is
trying to develop the technology necessary to build a nuclear bomb.
To curb Iran’s nuclear ambitions, the U.S. began enforcing economic sanctions that nearly halved Iran’s oil exports from 2012 to 2014, according to U.S. Treasury officials, but the country has still refused to suspend its nuclear research and development. Though there’s no indication that Iran has actually developed a nuclear bomb, the Obama administration and five other world powers would like to reach an agreement with Iran by the end of March that would ease economic sanctions, provided Iran hugely restrict its nuclear program.
Making up 72 percent of all exported products, oil is king in Iran.
And for good reason-- Iran holds the world’s fourth-largest crude oil reserves, though sanctions have greatly limited their production and foreign investment. While Iran’s current oil production is about 2.8 million barrels per day, Middle Eastern economies expert Dr. Kamran Dadkhah said only about 1 million barrels per day are exported. But a nuclear deal with the country would most likely ease Western sanctions, allowing Iran to increase oil exports.
“Right now if the sanctions were removed, it would take some time, but within a year it could add 1 million more barrels a day to their exports,” Dadkhah, an associate professor at Northeastern University, said, adding that Iran would first have to make “great investments” in some of its languishing oil fields before that could happen.
On paper, the U.S. doesn’t get much oil from Iran. It doesn’t even make the list of top five countries from which the U.S. imports petroleum: Canada, Saudi Arabia, Mexico, Venezuela, and Russia.
But Iran’s oil exports can still affect U.S. gas prices.
Ilan Goldenberg, director of the Middle East Security Program at the Center for a New American Security (CNAS), a nonprofit that develops national security policy, said a nuclear deal would quickly affect the already flooded global oil market, which would in turn move U.S. gas prices.
“The bottom line is—right now we also have a glut of oil and low oil prices, so this is going to strengthen and exacerbate things,” Goldenberg said of the potential deal. “If you get an agreement in the next couple weeks, you’ll probably see a pretty quick dip in prices.”
Since September 2014, there’s been a 50 percent drop in U.S. oil prices due
to the rise in world petroleum supplies and increased U.S. production
through drilling and fracking. There’s also been a decreased global
demand, as China’s economy has slowed down and Europe’s has stagnated.
Even if it took Iran a year to physically get more oil onto the international market, CNAS foreign policy expert Elizabeth Rosenberg said the immediate psychological impact of a deal would drop oil prices.
Even if it took Iran a year to physically get more oil onto the international market, CNAS foreign policy expert Elizabeth Rosenberg said the immediate psychological impact of a deal would drop oil prices.
“There’s a downward price movement when a deal is announced, when traders try to factor that in,” Rosenberg said.
How low prices could go is subject to
speculation, but Goldenberg said possibly to $20 to $30 per barrel. When
oil prices fell to six-year lows on Monday, March 16, it was $44 per
barrel, which translates to a national average of $2.42 at the pump.
Middle East Supply Interruptions
Yom Kippur War - Arab Oil EmbargoIn 1972 the price of crude oil was about $3.00 and by the end of 1974 the price of oil had quadrupled to $12.00. The Yom Kippur War started with an attack on Israel by Syria and Egypt on October 5, 1973. The United States and many countries in the western world showed strong support for Israel. As a result of this support Arab exporting nations imposed an embargo on the nations supporting Israel. Arab nations curtailed production by 5 million barrels per day (MMBPD) about 1 MMBPD was made up by increased production on other countries. The net loss of 4 MMBPD extended through March of 1974 and represented 7 percent of the free-world production.
If there was any doubt that the ability to control crude oil prices had passed from the United States to OPEC it was removed during the Arab Oil Embargo. The extreme sensitivity of prices to supply shortages became all too apparent. Prices increased 400 percent in six short months.
From 1974 to 1978 crude oil prices increased at a moderate pace from $12 per barrel to $14 per barrel. When adjusted for inflation the prices were constant over this period of time.
Crises in Iran and Iraq
Events in Iran and Iraq led to another round of crude oil price increases in 1979 and 1980. The Iranian revolution resulted in the loss of 2 to 2.5 million barrels of oil per day between November of 1978 and June of 1979. In 1980 Iraq's crude oil production fell 2.7 MMBPD and Iran's production by 600,000 barrels per day during the Iran/Iraq War. The combination of these two events resulted in crude oil prices more than doubling from $14 in 1978 to $35 per barrel in 1981.
U.S. and World Events and Oil Prices 1973-1981
US Oil Price Controls - Bad Policy?
The rapid increase in crude prices in this period would have been much less were it not for United States energy policy during the post Embargo period. The US imposed price controls on domestically produced oil in an attempt to lessen the impact of the 1973-74 price increase. The obvious result of the price controls was that U.S. consumers of crude oil paid 48 percent more for imports than domestic production. Of course U.S producers received less.
Did the policy achieve its goal? In the short term the recession induced by the 1973-1974 crude oil price rise was less. However, it had other effects as well. In the absence of price controls U.S. exploration and production would certainly have been significantly greater. The higher prices faced by consumers would have resulted in lower rates of consumption: automobiles would have had higher mileage sooner, homes and commercial buildings would have been better insulated and improvements in industrial energy efficiency would have been greater than they were during this period. As a consequence, the United States would have been less dependent on imports in 1979-1980 and the price increase in response to Iranian and Iraqi supply interruptions would have been significantly less.
1980s Oil Glut
Wikipedia - The 1980s oil glut was a serious surplus of crude oil caused by falling demand following the 1970s energy crisis. The world price of oil, which had peaked in 1980 at over US$35 per barrel ($101 per barrel today), fell in 1986 from $27 to below $10.[2][3] The glut began in the early 1980s as a result of slowed economic activity in industrial countries (due to the crises of the 1970s, especially in 1973 and 1979) and the energy conservation spurred by high fuel prices.[4] The inflation-adjusted real 2004 dollar value of oil fell from an average of $78.2 in 1981 to an average of $26.8 per barrel in 1986.[5]In June 1981, The New York Times stated an "Oil glut! ... is here"[6] and Time Magazine stated: "the world temporarily floats in a glut of oil,"[7] though the next week an article in The New York Times warned that the word "glut" was misleading, and that in reality, while temporary surpluses had brought down prices somewhat, prices were still well above pre-energy crisis levels.[8] This sentiment was echoed in November 1981, when the CEO of Exxon Corp also characterized the glut as a temporary surplus, and that the word "glut" was an example of "our American penchant for exaggerated language." He wrote that the main cause of the glut was declining consumption. In the United States, Europe and Japan, oil consumption had fallen 13% from 1979 to 1981, due to "in part, in reaction to the very large increases in oil prices by the Organization of Petroleum Exporting Countries and other oil exporters," continuing a trend begun during the 1973 price increases.[9]
After 1980, reduced demand and increased production produced a glut on the world market. The result was a six-year decline in the price of oil, which culminated by plunging more than half in 1986 alone.[2]
Why Oil Will Sink to $20-$40 Per Barrel [Excerpt]
September 15, 2010Seeking Alpha - Data can be found clicking into the XLS spread sheets found here. The fact is that the world is NOT running out of oil. World oil reserves have gone up every year, year over year since 99' to 00'. I've done my due dilligence and and know why, but I doubt many of the oil bulls have even bothered researching the data. They've all read TIME, Newsweek, and maybe even a book or two about peak oil. To them it's the alarmist, " where are we going to find more oil? We are running out!". If they ever bothered to look at the data they'd see 10 years of increased World oil reserves.
US Oil Consumption
2005 = 20.80 mbpd
2006 = 20.60 mpbd
2007 = 20.68 mpbd
2008 = 19.50 mpbd
2009 = 18.77 mpbd
2010 = 18.93 mpbd ( predicted)
2011 = 19.06 mpbd ( estimated)
So American oil consumption peaked in 2005, dropped 5 years in a row and "might" increase this year to 18.93 mbpd which is what we consumed over a decade ago in 1998. (Link to the EIA data.) The idea that we are using more and more and have less and less is simply not true.


No comments:
Post a Comment