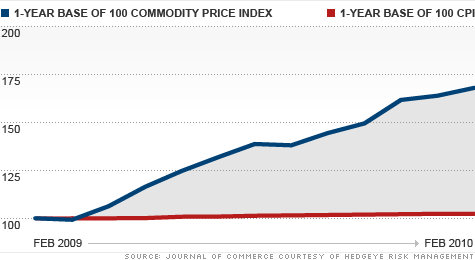
Food and Energy Purchases Make Up 36% of the Average Consumer's Budget
The Coming Inflation Wave
March 31, 2010Fortune - Whether the American economy is in an inflationary or deflationary environment sounds like it should be a fundamental and settled question. But due to the unprecedented financial crisis, the answer is actually subject to intense debate among economists.
Making economic projections is far from a scientific process, so it's not surprising to find valid arguments on both sides of the divide. The economists who are right will help investors drive returns over the next three years.
Inflation can be a positive or negative, depending on the level and duration of it in our economy. The main negative associated with inflation is a drop in purchasing power of money and, therefore, consumers. In extreme cases, consumers may actually start hoarding if they fear continued and aggressive price increases. The positive side of inflation is to decrease the real value of debt, or essentially provide debt relief.
How do we measure the level and duration of inflation to know whether it will help or hurt? In basic terms, inflation is a rise in prices of basic goods and services over a given period of time. In the United States, the government generally tracks inflation using the Consumer Price Index, or CPI.
Besides measuring inflation, CPI is also used to set income rates for more than 80 million people on entitlement programs. 48 million people on social security, 22 million food stamp recipients, and 4 million civil service retirees, have benefits tied to the CPI.
When inflation increases, so do their benefits. These payments are among the largest non-defense obligations in the federal budget. Not surprisingly, then, the government tends to understate inflation and has changed the way the CPI is calculated nine times since 1996.
Another common inflation metric is the Federal Reserve's core inflation, which it uses to measure overall inflation. The Fed excludes food and energy prices to smooth out short-term volatility. However, based on government data, food and energy purchases make up 36% of the average consumer's budget. The Fed's inflation graph might look nice and smooth, but it's probably not the best indicator for how your wallet feels when paying bills or buying groceries.So, conventional measures of inflation are imperfect at best. Which may embolden economists who dispute the idea that we are in an inflationary environment. They argue that our economy is too slack to be inflationary.
With a 9.7% February unemployment rate (the worst for February since 1983) and capacity utilization is at 72.7% (7.9 percentage below the average from 1972 to 2009), the thinking is, what's there to inflate? If employment and utilization of industry are low, then so are supply and demand which help set pricing levels. How, then, can prices possibly inflate?
Despite this argument, and primarily due to aggressively accommodative monetary policy in the United States and around the globe, we believe inflation is here, and poised to accelerate as all the slack in global economies begins to tighten. Measures of inflation for major nations around the globe give support to our conclusions: most of the G20 nations are reporting higher than normal inflation rates.
While we take some issue with the U.S. government's calculation of inflation, even federal economists have reported inflating prices this year. The January CPI came in at 2.6% and February reported at 2.1%. We expect March figures to accelerate even further.
The U.S. treasury and currency markets have also showed inflation signs for months, with the dollar up and the price of treasury bonds down. Also, as we recently noted to our clients, fixed versus floating interest rate swaps have turned negative for the first time in over a decade.
This means investors are aggressively betting that floating interest rates will increase, because the Fed, as it becomes more concerned about inflation, tends to raise interest rates to try and slow it down.
Back in the treasury market, 30-year treasuries have gone from yielding 3.73% to yielding 4.72% over the last year. That increase has happened for shorter-term treasuries -- the short end of the yield curve -- as well. And all these increases have happened despite the fact the Fed has maintained its target rate at 0 -- 0.25%. Bond yields, in other words, are already accounting for inflation.

Finally, in the chart above, we've plotted the Journal of Commerce Industrial Price Index over the last year. This index charts the price of key commodities that are used in industrial production. The chart is up and to the right, screaming inflation. Commodity inflation will likely lead China to report its first trade deficit in March in 6 years!
As they say, the markets don't lie, people do (or government statistics as the case may be). Based on the evidence above, we're sticking with our inflation call -- until the markets, and the data, tell us different.


No comments:
Post a Comment